DuckDB + Evidence.dev for Analyzing VC Data


Building Quickly with DuckDB and Evidence
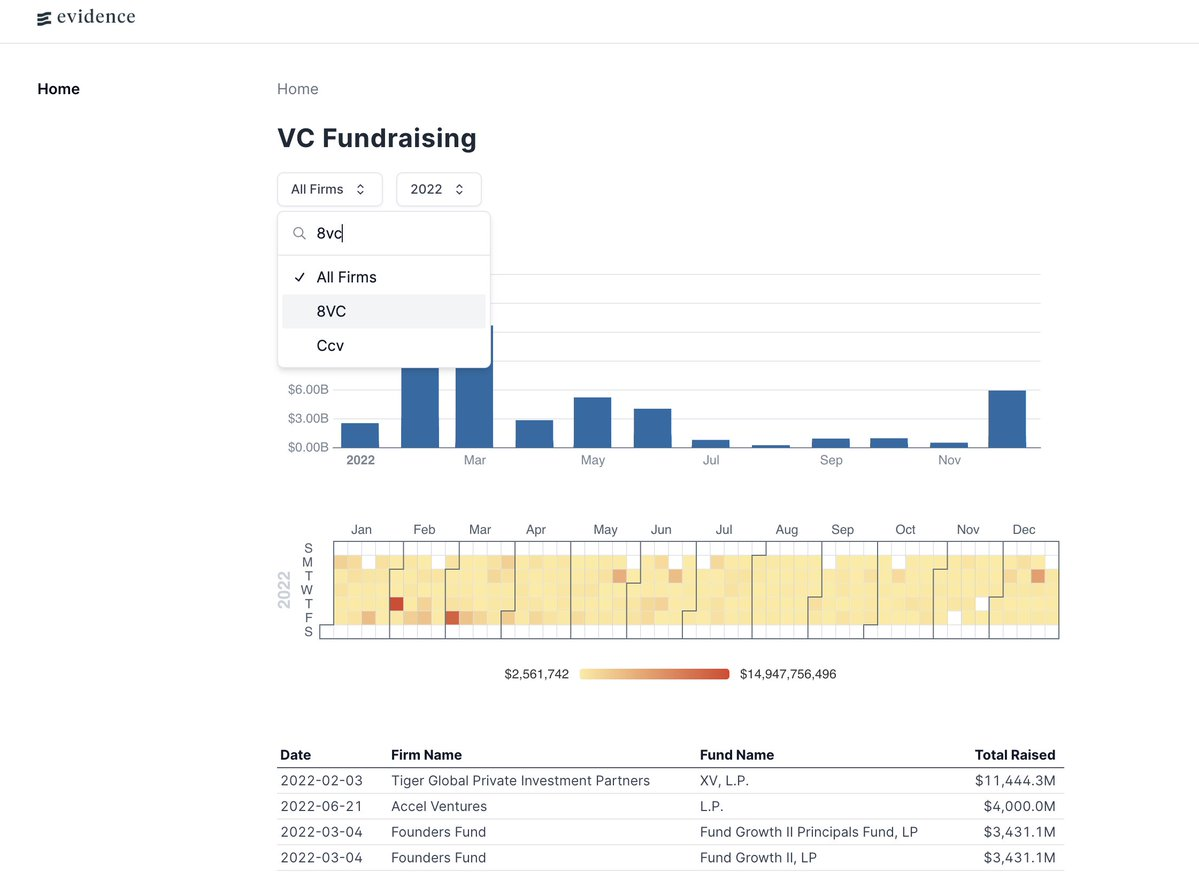
This week I whipped up a sweet little dashboard using DuckDB to parse TSV files and Evidence.dev to show data on VC fund filings.
In 100 lines of Python and 100 lines of Markdown/JS, I was able to put together a dashboard with filters, graphs, and data tables. For this post, I'll be walking through why this simplicity is awesome, why DuckDB and Evidence are great, and how you can do it too.

You can see this website live here: data.ethanfinkel.com
If you want to create this project on your own, I open sourced the code on Github here: https://github.com/ethanfinkel/SEC_Form_D_Evidence. Feel free to clone, fork, or contribute!
Why Building Websites as a Data Analyst Normally Sucks
I've been analyzing SEC filings on VC data for a couple years now. This data is all publicly available and is the source that Pitchbook, Crunchbase, and those platforms use for information on VC fundraising.
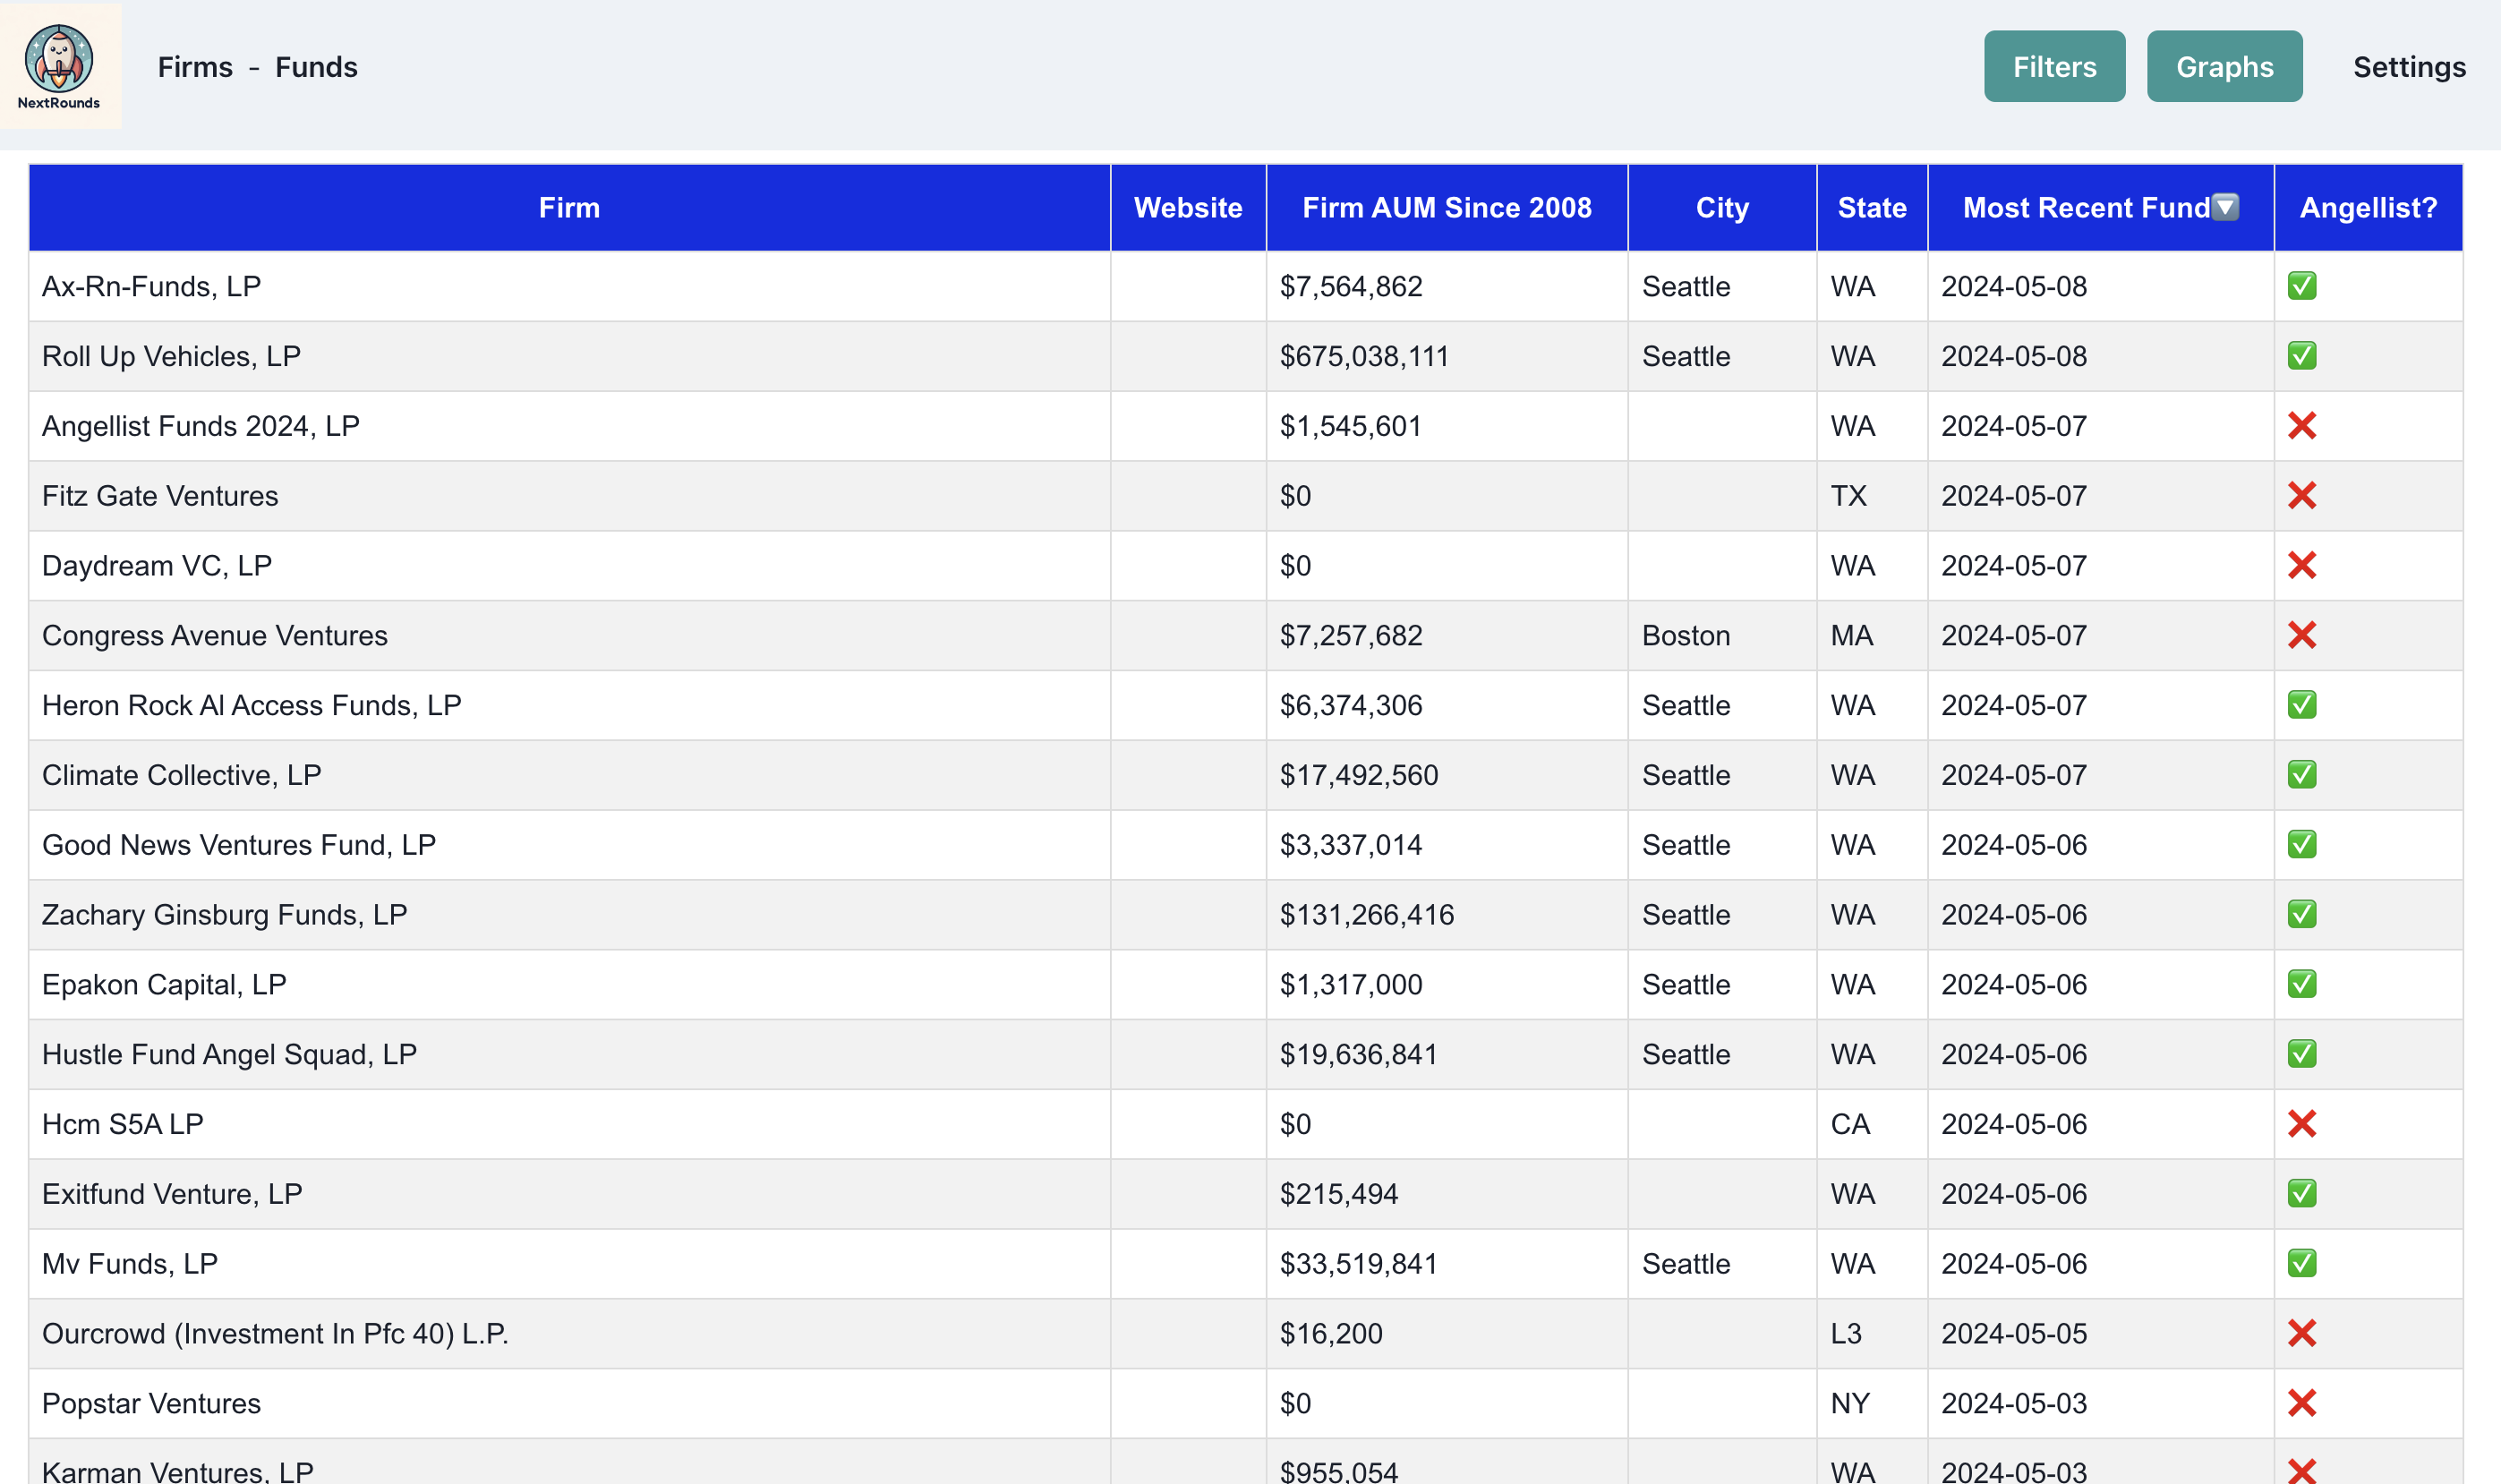
I started my website NextRounds.com to track and aggregate VC fundraising data and make it available for free because I'm cheap and don't want to pay the outrageous SaaS fees for these products.
Getting the data for NextRounds was not that hard, but as a data guy, I really struggled to get the front end to look reasonable. The state of modern front end is just tons of boiler plate code. I thought about using Retool for the front end, but that costs money as well, and this is a free little passion project. Thus, I sucked it up and wrote a bunch of React.

The code for the main data table in NextRounds is a couple hundred lines of JS, and frankly, I don't really think it looks that good. Modern front-end requires tons of boiler plate code to create a table, form, or make API calls. A great example in the filters page in NextRounds. Each filter has it's own state to manage with an input that drives the state. Then, to make the API call to the DB, all of the state needs to conditionally be added to the query, and finally the query is run asynchronously to update the table.
This simple interaction of choosing filters to power a table was in actuality ~400 lines of code. As someone with a Data Science background who doesn't write much front end code, this took me way longer than I'd like to admit.
How I Built This Project in 200 Lines of Code
Prepping the Data
My first step was to download TSV files on VC financing from the SEC website. VCs must file Form Ds when they fund raise and this is a great source of information. When a journalist cites a SEC filing on VC, this is it.
Link: https://sec.gov/data-research/sec-markets-data/form-d-data-sets
To gather the data from all of these TSVs together into one dataset, I used DuckDB. For the uninitiated, DuckDB is a lightning fast in-memory SQL database that many data people are quickly falling in love with. The ease of use, data portability, low overhead, embedded nature, and modern syntax are making it a fast favorite for data engineers, analysts, and software devs everywhere.
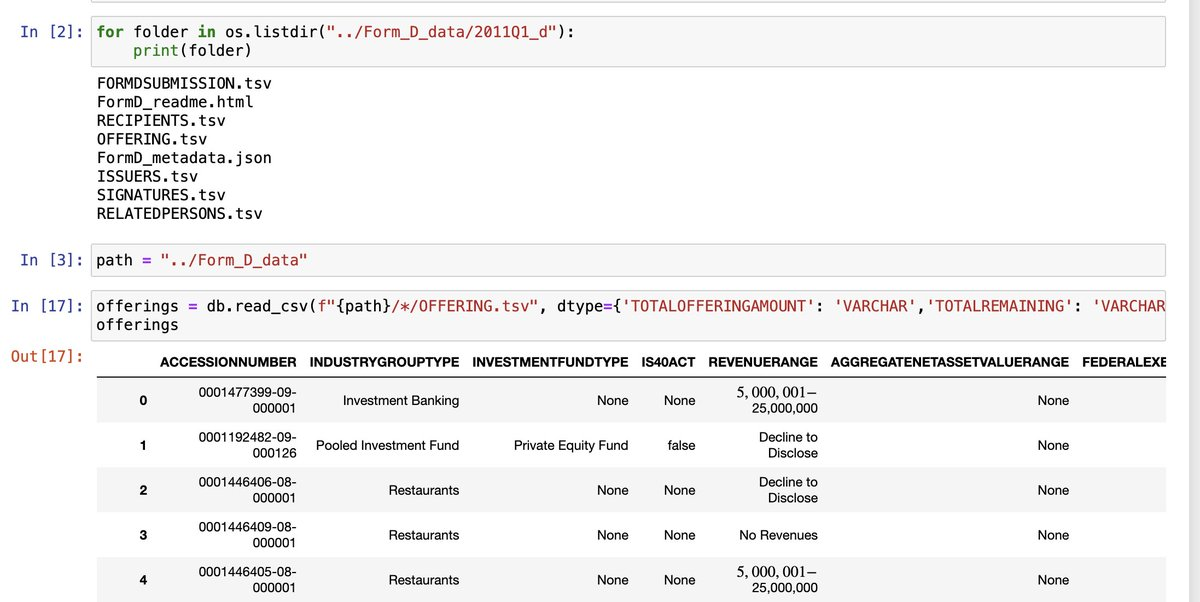
DuckDB is excellent at pulling data from TSV files and putting them into a database or data frame. In the old world, I would run a for loop over each folder and use the Pandas concatenate function to combine different data frames. This was super slow.
DuckDB has a great syntax where you can pull files recursively from directories by using a * in the path. This pulls all of the TSVs and automatically joins them! In the example below, my path is Form_D_data/*/OFFERING.TSV. This collected all 80 TSVs and put them into one data frame in 1 line of code and 1 second.

I repeated this step for the Issuers and FormDSubmissions TSVs and combined the data into one big data frame using DuckDB.

I did some data cleaning on this combined data frame to remove duplicates, parse firm and fund names from the SEC Entity Name, and normalize the date field.
With my newly cleaned data, I exported it using the DuckDB SQL engine to create a database file.

DuckDB really shines on importing and exporting data. It accepts basically any format and exports to any format as well. This is what makes it magic. SQL database, TSV, JSON, Excel, Parquet, data frame, etc. It doesn't matter where your data is or what format it's in. DuckDB lets you use it, query, and transform. All of these input formats are supported as output formats as well. I'm not exaggerating when I say that I wrote this exact pipeline before in 6x the code without using DuckDB. Not only was this simpler, it was faster!
Now that I had my data prepped and ready to analyze, I started an Evidence.dev project to build a dashboard for the data.
User Facing Analytics
Evidence is a great tool that uses DuckDB to read data from various sources and allows data analysts to easily create production notebooks using Markdown and JS. Evidence makes it easy to query your data by accepting data in a variety of formats and using DuckDB to parse the data into a Parquet file that can be loaded in the browser of the user for easy manipulation of the data.
I lamented the experience of writing front-end code as a Python and SQL guy who can get around a front-end in the first section of this post. However, I found Evidence really intuitive. A chart in React is ~100 lines of code to load the data, create the chart component, manage instance state, and display it on the page. In Evidence, creating a chart or table is only 4 lines of code, and it looks good without needing to specify styles.

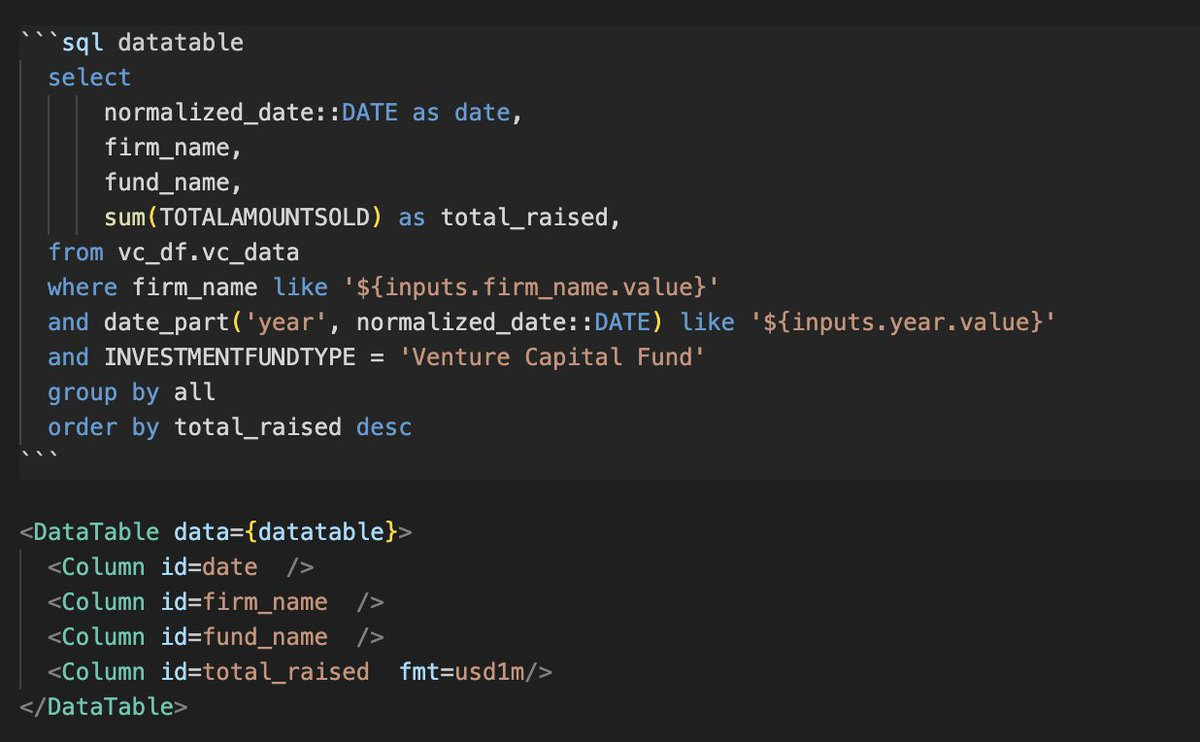
The core idea is that users specify SQL queries in special SQL blocks. Components can pull from these SQL blocks to generate charts, tables, heatmaps, and other widgets. The workflow is simple: query the data you want and pass the data as props to the pretty components.
This example shows a query for data in a table followed by the implementation of the table. All in about 15 lines of code.


An easy interface for generating graphs and tables is nice, but it's not too hard to build a static site with tables and graphs. The real magic is in how easy it is to build filters that interact with your data. Values from inputs can be used in WHERE clauses in subsequent queries. This makes it incredibly easy to create dynamic visualization that update automatically when users select filters.

In 100 lines of markdown and JS, I created a site with graphs, tables, heat maps, and filters. This was much less painless than writing my own React site to host these features and was pretty quick and fun. For future projects, I'll definitely be using open source libraries instead of building websites from scratch.

Again feel free to check it out live here: data.ethanfinkel.com
Hosting
I hosted this little project on a subdomain of this website at data.ethanfinkel.com. I use Vercel to host all of my projects now since it's so easy to set up. The workflow of pushing to Github and an auto-deploy kicking off immediately is pretty unbeatable. Setting up the subdomain was super easy and took all of 5 minutes in GoDaddy and Vercel.
Summary
DuckDB is a phenomenal tool for importing, cleaning, prepping, and exporting data. This was an example of a pipeline where it saved me time, ran quick, was ergonomic, and simply the best tool for the job. My new pipeline was way faster than the old one and written in a 1/10th of the code.
Evidence.dev is a great tool for quickly iterating on user facing analytics. It spend up my development time and allowed me to create something that looked good effortlessly.
The modern data analyst has tons of great tools at their disposal and the tool chain is only getting better.